SEBI Registered RA (INH000003507)
BSE Enlistment No:5203

SWING trading in a chart. Investing in the stock market – that’s what anybody focused on increasing his wealth wants to do. The first question that comes to your mind is, “Which is the best stock to invest in? How do you choose it? And most importantly, when to enter a particular stock?
In this article, we will tell you share market investment tips like how you can use the SWINGS in a chart to understand the character of a company and choose it for long-term investment. Swings in a candlestick chart show the price fluctuations or movements between highs and lows during a specific time frame.
1 Choose the top 500 companies in the stock market.
Before you jump into the stock market, do your research. Based on the market cap, make a list of the top-performing companies. Now it’s time to do some analysis. It’s time to open your trading software.
Go to your list and choose your first company.
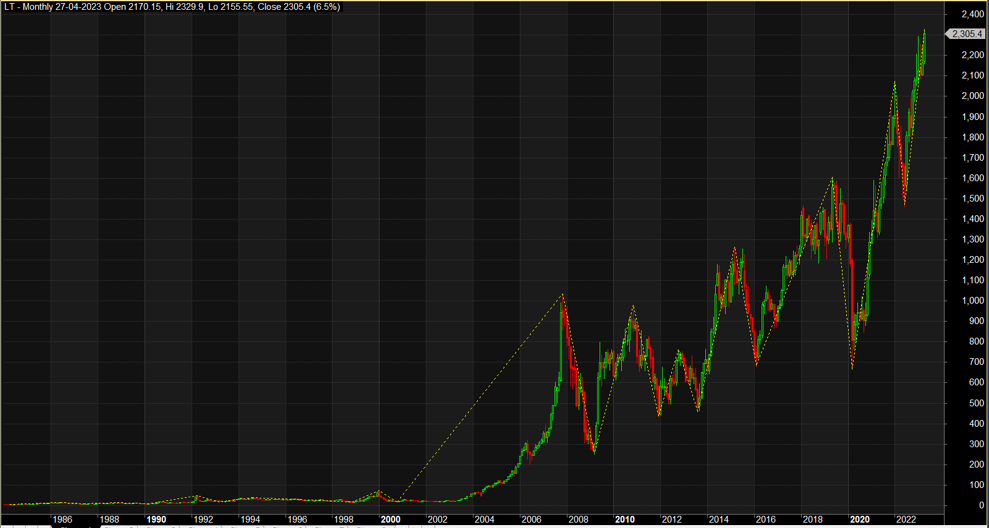
2 Calculate the SWINGS in the chart.
Once you have chosen the chart of a company, go to the date of inception and choose the lowest price point. From the lowest point draw a line to the highest point where the price has reached before it comes down. Choose the closing price of the lowest point and the highest price of the peak. That is one swing. Note down the price, the day and the date. Next from the highest price point look at how the price has swung and reached the lowest price. That is the second swing. Note down the price, day and date. Do this for all the swings in the chart. Swings, or the movement between these highs and lows, are crucial in understanding the market dynamics and making informed trading decisions.
3 Calculate the Simple Interest and CAGR.
Once you note down all these price swings, calculate the swing difference, simple return, and CAGR. When you do this, you will get valuable information to investors about the market sentiment and potential trends. You will see how a pattern repeats itself over a period. You will observe how the price doesn’t show any movement for years together and then spike. And when it increases, how it makes quantum swings and changes the game altogether. You will also see how some companies, after reaching their peak come crashing down.
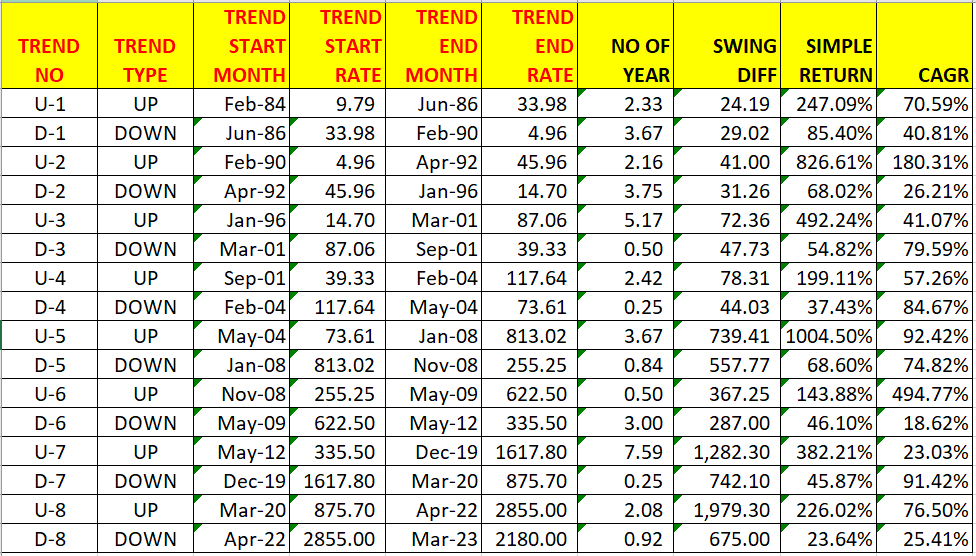
When you look at the table, what can you deduce?
If you do the SWING exercise for a few companies, you will realise there is always a pattern that a chart follows. When you understand these patterns, you will be able to work on your system and strategy and enter and exit the stock as per your rules.
We at ABJ Finstocks, have been doing these exercises for many years and that is how we recommend the right stock for our clients.
You can do it too. Do the SWING exercise and get ready to start your investment journey.


